Feature Analysis Tool
Visualize geospatial data in three different ways in the same application: in a map, a grid and a chart.
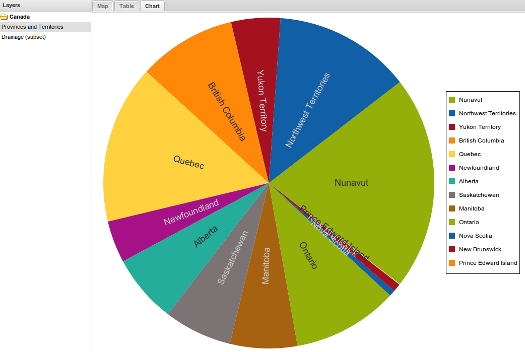
This webmapping application shows three different ways to visualize geospatial data: in an interactive map, in a spreadsheet-like grid and and charts, such as pie and column charts.
The client-side application uses OpenLayers 2.12, GeoExt 2.0 and ExtJS 4.1.0 as JavaScript frameworks. The base maps was built using OpenStreetMap data and is published using the OGC TMS protocol with a MapCache server. The features are obtained using the OGC WFS protocol, with MapServer.
The demo itself shows an “About this application” window upon visiting it, which contains more information and technical details.
- See the Live demo in action
- Learn more about ExtJS
- Learn more about GeoExt
- Learn more about MapCache
- Learn more about MapServer
- Learn more about OpenLayers
- Learn more about OpenStreetMap