Greenhouse gas
Greenhouse gas emission application.
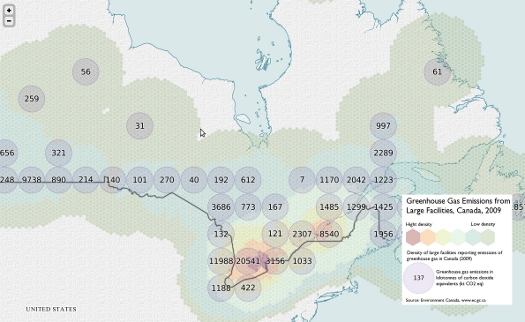
Greenhouse gas emission (GHG) application have two goals: show the density of facilities producing those GHG emissions show the distribution of GHG emissions in Canada
We usually used an “Heatmap” layers to show the density distribution. But, we tried to produce this density map using a hexagonal grid. Moreover, we used an “fish eyes effect” with d3js librairy (d3js.org) instead of “cluster effect” to get and view all points in the map.